Viterbi algorithm
Definition
The Viterbi algorithm is a dynamic programming algorithm for finding the most likely sequence of hidden states—called the Viterbi path—that results in a sequence of observed events, especially in the context of Markov information sources and hidden Markov models (HMM).
https://en.wikipedia.org/wiki/Viterbi_algorithm
Problem
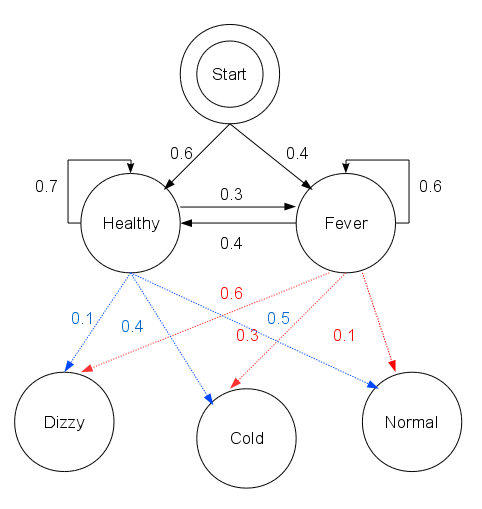
Consider a village where all villagers are either healthy or have a fever and only the village doctor can determine whether each has a fever. The doctor diagnoses fever by asking patients how they feel. The villagers may only answer that they feel normal, dizzy, or cold.
There are two states, “Healthy” and “Fever”, but the doctor cannot observe them directly; they are hidden from him. On each day, there is a certain chance that the patient will tell the doctor he is “normal”, “cold”, or “dizzy”, depending on their health condition.
The observations (normal, cold, dizzy) along with a hidden state (healthy, fever) form a hidden Markov model (HMM).
The patient visits three days in a row and the doctor discovers that on the first day he feels normal, on the second day he feels cold, on the third day he feels dizzy. The doctor has a question: what is the most likely sequence of health conditions of the patient that would explain these observations?
Code
obs = ("normal", "cold", "dizzy")
states = ("Healthy", "Fever")
start_p = {"Healthy": 0.6, "Fever": 0.4}
trans_p = {
    "Healthy": {"Healthy": 0.7, "Fever": 0.3},
    "Fever": {"Healthy": 0.4, "Fever": 0.6},
}
emit_p = {
    "Healthy": {"normal": 0.5, "cold": 0.4, "dizzy": 0.1},
    "Fever": {"normal": 0.1, "cold": 0.3, "dizzy": 0.6},
}
def viterbi(obs, states, start_p, trans_p, emit_p):
    V = [{}]
    for st in states:
        V[0][st] = {"prob": start_p[st] * emit_p[st][obs[0]], "prev": None}
    # Run Viterbi when t > 0
    for t in range(1, len(obs)):
        V.append({})
        for st in states:
            max_tr_prob = V[t - 1][states[0]]["prob"] * trans_p[states[0]][st]
            prev_st_selected = states[0]
            for prev_st in states[1:]:
                tr_prob = V[t - 1][prev_st]["prob"] * trans_p[prev_st][st]
                if tr_prob > max_tr_prob:
                    max_tr_prob = tr_prob
                    prev_st_selected = prev_st

            max_prob = max_tr_prob * emit_p[st][obs[t]]
            V[t][st] = {"prob": max_prob, "prev": prev_st_selected}

    for line in dptable(V):
        print(line)

    opt = []
    max_prob = 0.0
    best_st = None
    # Get most probable state and its backtrack
    for st, data in V[-1].items():
        if data["prob"] > max_prob:
            max_prob = data["prob"]
            best_st = st
    opt.append(best_st)
    previous = best_st

    # Follow the backtrack till the first observation
    for t in range(len(V) - 2, -1, -1):
        opt.insert(0, V[t + 1][previous]["prev"])
        previous = V[t + 1][previous]["prev"]

    print ("The steps of states are " + " ".join(opt) + " with highest probability of %s" % max_prob)

def dptable(V):
    # Print a table of steps from dictionary
    yield " ".join(("%12d" % i) for i in range(len(V)))
    for state in V[0]:
        yield "%.7s: " % state + " ".join("%.7s" % ("%f" % v[state]["prob"]) for v in V)
viterbi(obs,
        states,
        start_p,
        trans_p,
        emit_p)
           0            1            2
Healthy: 0.30000 0.08400 0.00588
Fever: 0.04000 0.02700 0.01512
The steps of states are Healthy Healthy Fever with highest probability of 0.01512
This reveals that the observations [‘normal’, ‘cold’, ‘dizzy’] were most likely generated by states [‘Healthy’, ‘Healthy’, ‘Fever’].